CT perfusion (CTP) imaging is a technique that uses the contrast attenuation curves within tissues and their afferent and efferent vessels to provide measures of blood volume, blood flow, transit of blood through the tissue (mean transit time) and leakiness of blood vessels (permeability × surface area). CTP requires rapid intravenous bolus injection (4–10 mL/s) and repeated CT data acquisition of the same anatomical area. It is therefore an extreme form of multiphase imaging, in which the radiation dose during each phase is minimised to avoid excessive radiation exposure while still providing physiological information. CTP is now well-established in the brain for the diagnosis of stroke (Fig. 1) and is becoming increasingly important in oncological imaging to determine the effects of anti-angiogenic treatment in the context of early-phase clinical trials.
Two principal methods for analysis of the images have been described: one based on the slope of contrast enhancement and the other based on Fourier deconvolution methods. The former requires higher injection rates, is more robust, but does not give absolute measurements. The latter is more susceptible to noise and data inconsistencies but does provide absolute values.
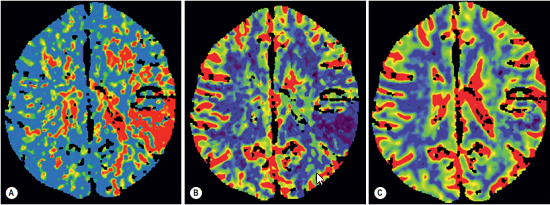
FIGURE 1 ■ Perfusion CT in left middle cerebral artery territory infarct. Mean transit time (MTT) map (A) shows an area of delayed MTT in the posterior part of the left middle cerebral artery territory. Cerebral blood flow (CBF) map (B) shows a larger area of reduced CBF indicating ischaemic and infarcted tissue. Cerebral blood volume CBV map (C) shows a small area of reduced CBV in the left parietal convexity corresponding to core infarct. The area of mismatch between the regions of reduced CBF and CBV is potentially salvageable ischaemic penumbra.
责任编辑:admin
上一篇:没有了
下一篇:医学文章阅读——Dual-Energy CT

微信公众号搜索“译员”关注我们,每天为您推送翻译理论和技巧,外语学习及翻译招聘信息。